
Welcome to Our Interactive Dashboard!
Our dashboard provides a user-friendly way to visualize key data related to our investments, community impact, and overall performance as a CDFI. This interactive tool allows you to explore critical insights, track trends, and measure the success of our investments in work, housing, and health. With just a few clicks, you can dig deeper into specific metrics and tailor the view to your specific interests.
How to use the dashboard:
Navigate through different tabs to access data, impact metrics, and portfolio composition.
Hover over charts and graphs to reveal more detailed information.
Filter data by selecting specific investment categories, time periods, or geographic areas using the filters on the side.
Select “Fit to Page” at the bottom right of the dashboard for an expanded view.
If you have any questions or need assistance, please contact Austin Marshall at amarshall@metafund.org.

“Without MetaFund, many aspects of Pivot Preserves would still be a dream. MetaFund has turned our goals and aspirations into reality and has launched Pivot Preserves years ahead of the anticipated expectation.”
— JENNIFER GOODRICH, President & CEO, Pivot Preserves
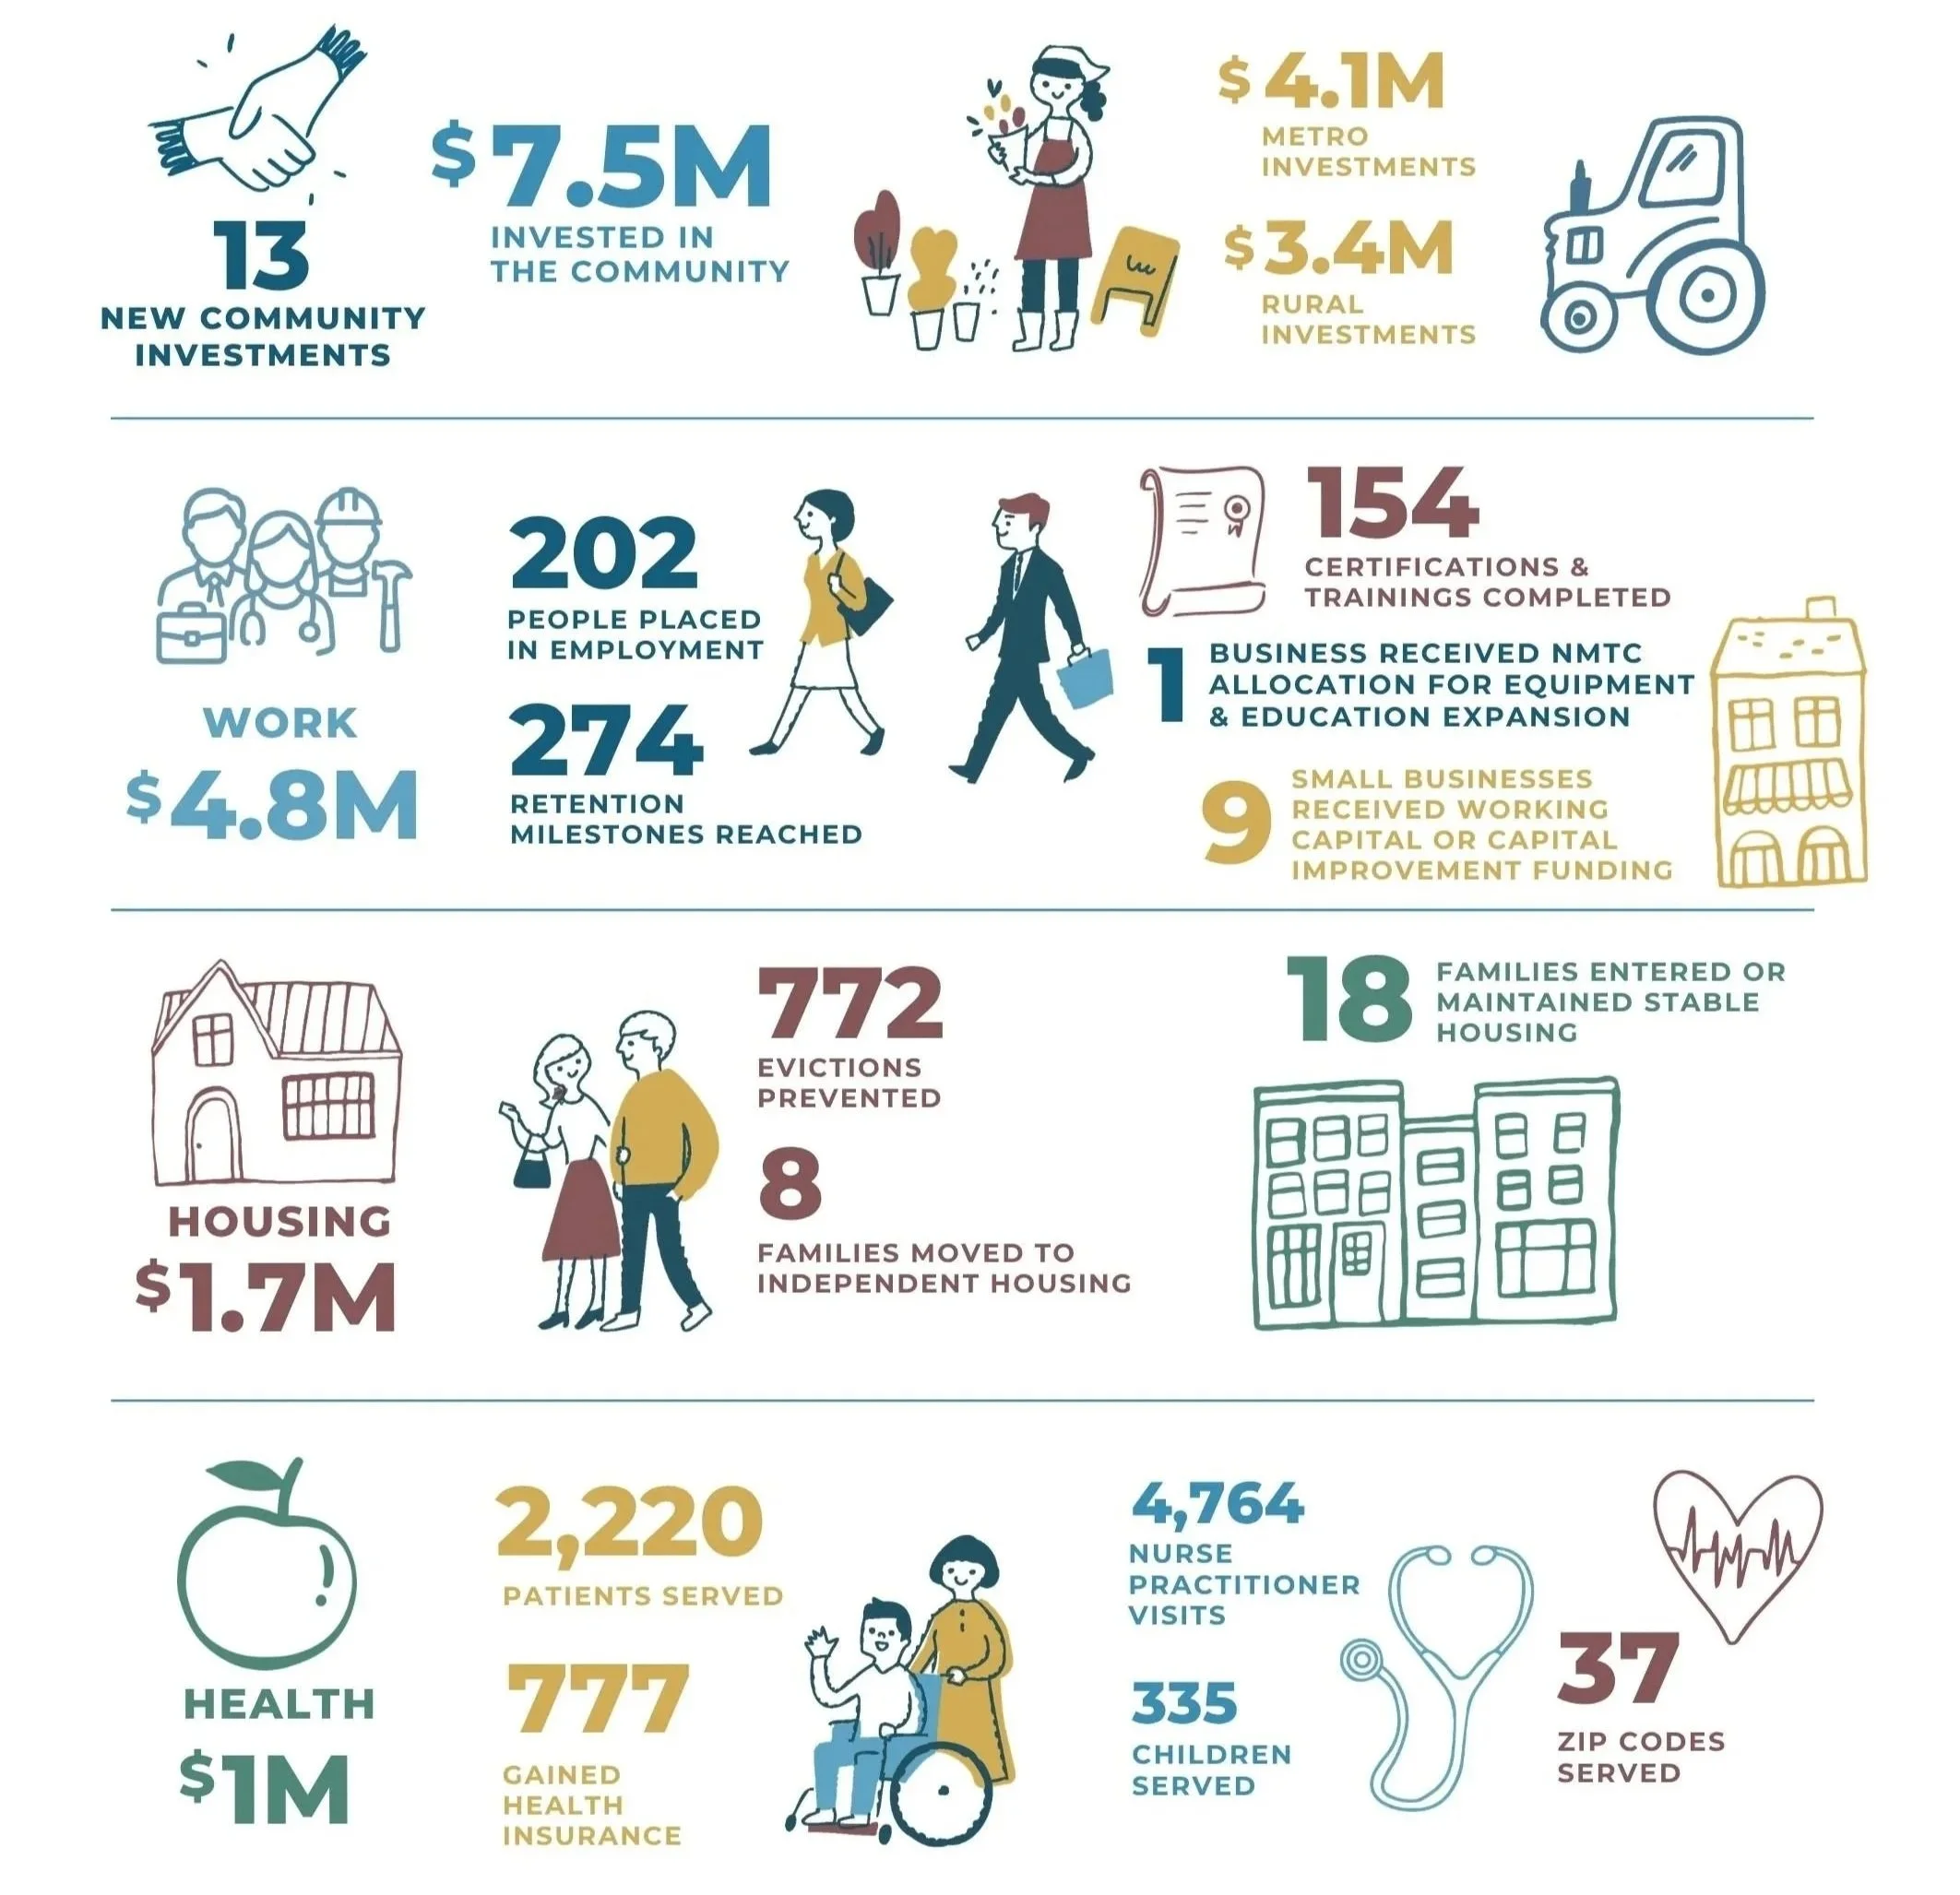
Our Investments’ Impact in 2025
“Having community members like MetaFund partner with agencies is a unique and inspiring approach to help change individual lives on a local level.”
— AMY GARRISON, Chief Administrative Officer, GMH